What Is TradingView? A Guide for CFD Traders
In this article

TradingView is a cloud-based advanced charting platform and social network used by retail traders to analyse financial markets. While it provides drawing tools and custom indicators via Pine Script, it is not a brokerage firm itself, meaning users must connect a supported third-party broker API to execute live trades directly from the charts.
TradingView is a cloud-based charting platform and social network used by retail and professional traders to analyse financial markets. If you are asking what is TradingView and whether it is right for your CFD trading setup, the short answer is that it is an analysis tool, not a broker.
For CFD traders, the key point is that TradingView is an analysis platform, not a broker. It provides charts, indicators and drawing tools, but it does not hold client funds unless a trader connects an account with a supported third-party broker.
The quality and timing of the market data also matter. Free or delayed data may not show the same prices or bid-ask spreads as a trader’s live CFD account. This difference can lead to slippage or a different execution price when an order is placed through the broker’s platform.
Quick Takeaways
- TradingView is a cloud-based charting and market analysis platform, not a standalone broker.
- Free plans may include delayed or aggregated data, which might not reflect the live prices and spreads offered by your CFD broker.
- Pine Script allows traders to create custom indicators and test trading ideas using historical data. However, past performance does not guarantee future results.
- Traders can only place orders through TradingView by connecting an account with a compatible third-party broker.
Understanding the Core Platform: Analysis vs. Execution
TradingView is primarily a charting and market analysis platform rather than a financial institution that holds client funds. For traders new to the platform, understanding what is TradingView versus what a broker does is the first step to using it safely. It provides advanced charting tools, technical indicators and extensive historical market data, but it does not act as the counterparty to your CFD trades or hold your trading capital.
A common misconception among retail traders is that the price shown on a chart will always match the price at which their order is executed. This is one reason why understanding what is a trading platform is important. TradingView is designed for analysis, while your broker's trading server is responsible for executing your orders. These are separate systems and may use different liquidity providers and market data feeds.
As a result, the price you see on TradingView may differ slightly from the price available through your broker. In fast-moving markets, these differences can lead to slippage or a different execution price than expected.
Key Features of TradingView
TradingView offers a wide range of tools, from simple web-based charts to advanced strategy testing, making it suitable for both new and experienced traders. Whether you are just learning what is TradingView or already using it daily, these features are worth understanding in detail.
Advanced Charting and Technical Analysis Tools
TradingView provides a comprehensive selection of chart types, including candlestick, line and bar charts, as well as more advanced options such as volume profile charts. It also includes a wide range of drawing tools, allowing traders to identify support and resistance levels, trend lines and chart patterns with ease.
Pine Script and Strategy Backtesting
TradingView's proprietary Pine Script language allows traders to create custom indicators and test trading strategies using historical market data. This can help traders refine their approach before using it in live markets.
However, backtesting has its limitations. Historical results do not reflect real trading conditions, where factors such as slippage, wider spreads and changing market liquidity can affect execution. A strategy that performs well in a backtest may produce different results when used in live market conditions.
Social Trading Community
TradingView also includes a global community where traders share market analysis, trading ideas and custom Pine Script indicators. This can be a useful way to learn from other market participants and discover different trading approaches.
However, traders should assess any shared ideas carefully rather than following them without question. Every trading strategy carries risk, and understanding how a setup works is far more important than simply copying another trader's analysis.
How CFD Traders Use TradingView
CFD traders typically use TradingView to analyse markets and identify potential trading opportunities before placing orders through their chosen CFD broker.
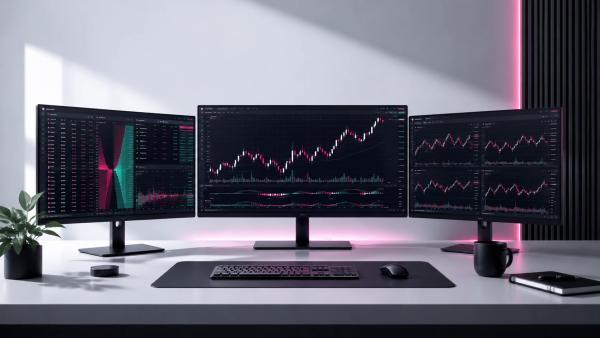
Many retail traders use a two-screen setup. They carry out multi-timeframe technical analysis on TradingView's web-based charts while keeping their broker's trading platform open to execute trades. Others choose to connect a supported broker account directly to TradingView, allowing them to place orders from the chart through an API integration. Before connecting any broker to TradingView, it is worth checking that the broker is authorised by a recognised regulator, such as the FCA in the UK, to help reduce the risk of dealing with an unregulated or fraudulent provider.
In practice, many traders prefer to use TradingView for analysis while executing trades through their broker's own platform. This approach makes it easier to compare live prices and manage positions, particularly during periods of high market volatility. The most suitable workflow depends on the trader's strategy, the broker they use and their preferred trading setup.
Tier | Market Data | Indicators Per Chart | Best Suited For |
|---|---|---|---|
Basic (Free) | Exchange-dependent; delayed for many markets unless a real-time data subscription is added | Up to 2 | Learning, chart analysis and casual market monitoring |
Essential | Real-time data available with supported exchange subscriptions | Up to 5 | Active retail traders |
Plus | Real-time data available with supported exchange subscriptions | Up to 10 | Frequent traders using multiple indicators |
Premium | Real-time data available with supported exchange subscriptions | Up to 25 | Advanced technical analysis and strategy development |
Data accurate as of 2026 according to TradingView's pricing page. Plan features and indicator limits are subject to change; please verify current details directly with TradingView before subscribing.
The Hidden Costs: Data Delays and Execution Risks
Using a third-party charting platform can offer greater flexibility, but it is important to understand how market data and order execution may differ from your broker's trading platform.
Delayed Market Data
The free version of TradingView may use delayed or exchange-dependent market data for some instruments unless you subscribe to an official real-time data feed. As a result, the price shown on your chart may not always match the live bid and ask prices available through your CFD broker.
For example, a breakout shown on a delayed chart may already have occurred by the time you place a trade. This can result in your order being filled at a different price from the one you expected, particularly during periods of high market volatility.
Execution Latency
If you place trades through a broker connected to TradingView, your order is transmitted through several systems before reaching the market. In most trading conditions, this additional processing time is unlikely to make a noticeable difference.
However, for short-term trading strategies such as scalping or high-frequency day trading, even small delays can affect the final execution price, especially when markets are moving quickly. This is one reason why some traders prefer to analyse markets on TradingView while placing orders directly through their broker's trading platform during volatile market conditions. For more detail on how CFD risk warnings are regulated, see the FCA's guidance on high-risk investments, which outlines the disclosure standards UK-authorised brokers must follow.
TradingView vs. MetaTrader: Which Fits Your Setup?
The right platform depends on how you trade. TradingView focuses on charting and market analysis, while MetaTrader (MT4 and MT5) is designed primarily for trade execution and automated trading.
TradingView is a cloud-based platform that can be accessed through a web browser or mobile app, making it easy to analyse markets across multiple devices. It offers a clean interface, a wide range of charting tools and a large community where traders share ideas and custom indicators.
MetaTrader, by comparison, is commonly used through desktop software provided by CFD brokers, although web and mobile versions are also available. It supports automated trading through Expert Advisors (EAs) and remains one of the most widely used platforms for Forex and CFD trading.
For many traders, the choice is not between one platform or the other. Instead, they use TradingView to analyse markets and identify trading opportunities, then place and manage trades through MetaTrader or their broker's proprietary trading platform.
Feature | TradingView | MetaTrader (MT4/MT5) |
|---|---|---|
Primary purpose | Charting and market analysis | Trade execution and automated trading |
Platform | Cloud-based (web, desktop and mobile) | Desktop, web and mobile |
Charting tools | Extensive built-in charts and drawing tools | Comprehensive charting with custom indicators |
Automation | Pine Script | Expert Advisors (EAs) using MQL4/MQL5 (MetaQuotes Language) |
Community | Large community for sharing ideas and indicators | Large global user base with third-party tools |
Best suited for | Market analysis, charting and strategy development | Executing trades and automated trading |
Conclusion
TradingView is a widely used platform for charting, technical analysis and market research, and understanding what is TradingView helps set the right expectations before you trade. It offers a broad range of analytical tools and gives traders access to a global community where ideas and custom indicators are shared.
However, it is important to remember that TradingView is an analysis platform rather than a CFD broker. Market data may vary depending on your subscription and exchange data feeds, while order execution depends on the broker you choose. Understanding these differences can help you make more informed trading decisions and avoid unexpected execution issues.
If you're comparing brokers, our CFD broker reviews examine trading costs, execution quality, platform features and other key factors to help you choose a broker that suits your trading style.
FAQ
Does TradingView Offer a Mobile App?
Yes. Beyond understanding what is TradingView as a charting platform, it is worth knowing that TradingView offers dedicated mobile apps for both iOS and Android. Your watchlists, saved charts and custom indicators are synchronised across devices, allowing you to monitor the markets wherever you are.
Can I Link My Existing CFD Broker to TradingView?
You can connect your CFD broker only if it is supported by TradingView. If your broker is not available, you can still use TradingView for charting and market analysis before placing trades through your broker's own trading platform.
What Programming Language Does TradingView Use?
TradingView uses its own scripting language, called Pine Script. It enables traders to create custom indicators, develop trading strategies, set alerts and backtest ideas using historical market data, even without advanced programming experience.
How Can I Get Real-Time Market Data on TradingView?
Real-time market data depends on the market and exchange you are viewing. Some instruments include real-time data, while others require an official exchange data subscription. Even with a paid TradingView plan, you may need to purchase additional exchange data to access live prices for certain markets.
Is TradingView a Trading Platform?
Yes, TradingView can be used as a trading platform when connected to a supported broker, allowing traders to analyse markets and place trades from within the platform. This is often the final piece of the puzzle when learning what is TradingView and how it fits into a CFD trading workflow. However, its primary focus is charting and market analysis. Order execution and account management are still provided by your connected CFD broker.