What Is Order Flow Trading? Reading Market Depth Explained
In this article

Order flow trading analyses executed trades and, where available, resting orders to assess short-term buying and selling activity. Unlike traditional chart analysis, it focuses on current transactions and available liquidity, helping traders understand how orders interact at different price levels.
Order flow trading analyses executed trades and available liquidity to assess short-term buying and selling activity in a financial market.
For retail Contract for Difference (CFD) traders, order flow tools can provide additional information about liquidity, trading activity and execution conditions. However, CFD trading is generally conducted over the counter (OTC), so the depth shown on a CFD platform may not represent the complete market.
Quick Takeaways
- Order flow analysis looks at executed trades and, where available, resting orders in real time.
- On a centralised order book, limit orders can provide liquidity while market orders typically consume available liquidity.
- Common order flow tools include Depth of Market (DOM), Footprint charts and Time & Sales.
- Retail CFD traders may see data from an underlying exchange or a broker's liquidity sources, rather than a single consolidated CFD order book.
- Order flow can provide useful context, but it cannot reliably identify who placed an order or guarantee the market's next direction.
What Is Order Flow Trading?
Order flow trading is a method of analysing how orders interact with available liquidity as transactions take place. Traditional technical analysis mainly studies historical price and volume data, while order flow analysis focuses more closely on current executions and, where available, resting orders.
On a centralised exchange, aggressive buying can consume sell orders available at the best ask and, if demand continues, at higher price levels. Aggressive selling can similarly consume available bids and contribute to lower transaction prices.
This doesn't mean there are literally more buyers than sellers in an executed trade: every transaction has both sides. Instead, price can move when aggressive orders consume the liquidity available at current prices or when market participants adjust or cancel their quotes.
The order book is an electronic record of bids and offers available at different price levels on markets that use a central limit order book. It can help traders see where visible liquidity is concentrated and how that liquidity changes as orders are added, executed or cancelled.
Order-book data may also indicate areas of strong trading interest, but it does not normally reveal the identity or full position of an institutional participant. Some orders may also be hidden, modified or cancelled before execution.
Mechanics of the Order Book: Market vs Limit Orders
Understanding market depth starts with the two main order types used in exchange-traded markets:
- Limit orders: A limit order sets the highest price a buyer is prepared to pay or the lowest price a seller is prepared to accept. On a centralised exchange, resting limit orders can sit in the order book and contribute to visible bid or ask depth until they are filled, modified or cancelled.
- Market orders: A market order seeks immediate execution at the best available price. It generally trades against liquidity already available in the order book. A sufficiently large order may be filled across several price levels if there is not enough liquidity available at the best price.
The interaction between incoming orders and resting liquidity contributes to price discovery. If a large market order cannot be filled entirely at the best available price, the remaining quantity may trade at progressively less favourable prices. For example, a 50-lot order might fill 20 lots at the best ask, another 20 lots at the next level, and the final 10 lots one tick higher still.
These mechanics require additional care in CFD trading. Retail CFD orders do not necessarily enter the same central order book that may be displayed for an underlying futures, share or other exchange-traded market. Execution instead depends on the CFD provider's pricing and execution model.
You should also weigh up total trading costs — spreads, commissions and overnight fees — when assessing an execution environment.

Core Tools for Reading Order Flow
You can use several tools to examine transactions and market depth:
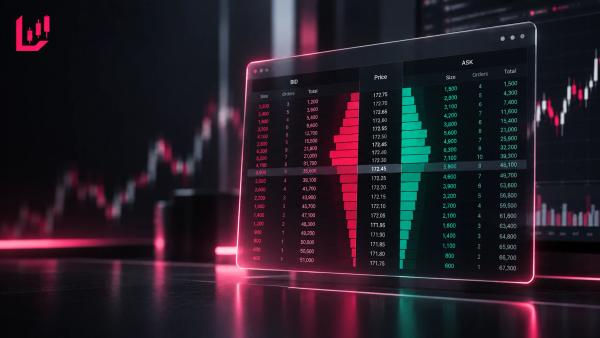
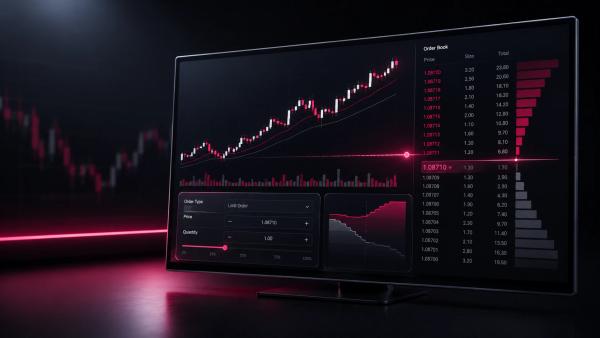
- Depth of Market (DOM): Also known as an order ladder, a DOM shows available bid and ask liquidity at different price levels. On a centralised exchange, it represents visible resting orders in that particular order book. Traders may use changes in depth to assess short-term liquidity conditions, although displayed orders can be modified or cancelled.
- Time & Sales (the tape): A real-time record of completed transactions. Depending on the data feed, it can show information such as execution time, price and trade size, and may classify trades according to whether they occurred at or near the bid or ask.
- Footprint charts: Charts that break down executed volume at individual price levels within each bar. They can help traders examine differences between buying and selling activity in more detail than a standard candlestick chart.
- Volume Profile: A histogram showing how much trading volume occurred at different price levels over a selected period. Traders often use it to identify areas where relatively high or low volumes have traded, although the interpretation of those areas is not a prediction of future price behaviour.
Footprint charts can, for example, provide extra context when price reaches a previously identified support or resistance area. A trader might compare executed volume and bid-ask imbalances with the price reaction at that level. These signals should be treated as supporting information rather than proof that a level will hold or break.
Order Flow in CFD Trading: Centralised Books vs OTC Execution
Order flow data differs significantly between exchange-traded markets and OTC CFD trading.
Centralised futures exchanges use central limit order books that bring together orders submitted to that particular trading venue. This creates a transparent view of the visible liquidity available on the exchange, although it doesn't reveal every participant's broader position or trading activity across other venues.
CFDs, by contrast, are OTC derivatives. A retail trader enters into a CFD with a provider rather than buying or selling the underlying asset on a central exchange. The provider may act as counterparty and may hedge some or all of its exposure with external liquidity providers or in the underlying market, depending on its execution model.
This distinction affects how order flow data should be interpreted:
- Underlying or aggregated data: A CFD platform may show market depth from an underlying exchange, quotes from connected liquidity providers or data specific to the provider's trading environment. It shouldn't automatically be treated as a complete picture of global buying and selling interest.
- Slippage: During volatile or illiquid conditions, an order may be executed at a different price from the one expected or requested. This can occur when prices change quickly or insufficient liquidity is available at the quoted level.
- Spread widening: CFD spreads can widen when underlying liquidity falls, volatility increases or major economic news causes rapid repricing.
You should also recognise the risks that come with leveraged CFDs. Under current FCA rules, CFD providers must disclose the percentage of their own retail client accounts that lose money. This figure must be updated using a prescribed calculation based on the preceding 12 months, with the calculation performed every three months. There's therefore no single current FCA loss percentage that applies to every CFD provider.
Historical ESMA analysis found that 74–89% of retail CFD accounts typically lost money across the EU jurisdictions examined. That figure provides useful regulatory context, but it should not be presented as a current FCA-wide statistic.
Common Pitfalls in Order Flow Analysis
Order flow can provide useful information about market activity, but raw depth data has important limitations:
- Displayed liquidity can disappear: A large resting order does not guarantee that the order will remain available or be executed. Orders can legitimately be changed or cancelled as market conditions change.
- Spoofing can create misleading signals: Spoofing involves placing bids or offers with the intention of cancelling them before execution. Such activity can create a false impression of supply, demand or market depth and is prohibited in regulated US futures markets.
- Low-liquidity markets can distort signals: Thin markets and quieter trading periods may have relatively little depth, so comparatively small orders can have a larger effect on displayed liquidity and transaction prices.
- Visible depth is not the whole market: Hidden orders, liquidity on other venues and activity outside the displayed order book may not appear in a trader's DOM.
- Trading costs can accumulate: Frequent use of aggressive orders may increase exposure to spreads, commissions and slippage. These costs can materially affect the net result of a high-turnover trading approach.
How Can Traders Use Order Flow in Practice?
Trading order flow effectively means using it alongside a broader trading plan to assess liquidity and refine execution decisions, rather than treating it as a standalone signal. For example, you might compare a Footprint chart with an existing support or resistance level, monitor changes in displayed depth, and then consider whether current transaction activity supports your original analysis.
Don't use order flow signals in isolation. Visible liquidity can change quickly, and no imbalance, Footprint pattern or DOM signal can reliably guarantee the next price movement.
Risk controls matter even more when CFDs are involved, since leverage increases your exposure relative to the capital you've committed to a position. This can increase both potential gains and losses.
When comparing trading environments, our CFD broker reviews explain factors such as spreads, commissions, platform tools and execution models.
Trading CFDs carries a high risk of losing money rapidly due to leverage. Order flow analysis is an analytical framework for studying market activity, liquidity and execution. It doesn't provide a guaranteed method of predicting market direction and shouldn't be treated as financial advice.
FAQ
What Is Order Flow Trading and How Does It Work?
Order flow trading analyses executed trades and, where available, resting orders to assess short-term buying and selling activity. On a centralised order book, traders can compare incoming aggressive orders with available bid and ask liquidity to see how orders are interacting at different price levels.
What Is the Difference Between Technical Analysis and Order Flow Trading?
Traditional technical analysis studies historical price and volume data using tools such as chart patterns and technical indicators. Order flow analysis focuses more closely on current transactions and available liquidity, using data such as executed trades, order-book depth and bid-ask activity.
Can You Trade Order Flow on Retail CFDs?
Yes, but there are limitations. CFD platforms may provide market-depth data from an underlying exchange or liquidity information from the provider's own sources. CFDs are traded over the counter (OTC), so a retail CFD order does not normally enter the central public order book of the underlying exchange.
What Is Depth of Market (DOM) in Order Flow Analysis?
Depth of Market (DOM), also known as an order ladder, displays visible resting buy and sell orders at different price levels in a centralised order book. It can help traders assess available liquidity around the best bid and best ask, although orders may be modified or cancelled before execution.
What Are Spoofing and Phantom Liquidity?
Spoofing involves placing orders with the intention of cancelling them before execution in order to create a misleading impression of market supply, demand or liquidity. More broadly, displayed liquidity can disappear when orders are modified or cancelled, so large orders shown on a DOM should not automatically be treated as genuine support or resistance.